
Last reviewed 7 September 2026. Every figure on this page was checked against the source named next to it; where two official series disagree, the difference is stated.
Australia's tourism industry has moved from recovery to record. In the year ending December 2025, international visitors made 8.3 million trips to Australia and spent a record A$39.2 billion in the country, while the visitor economy as a whole — domestic and international combined — generated A$192.4 billion, up 6.5% on 2024. By the year ending March 2026 those figures had climbed again, to 8.5 million trips and A$40.9 billion, although monthly ABS arrivals softened in mid-2026. Tourism now contributes A$81.1 billion to GDP and supports 696,000 filled jobs. The figures below come from official sources — Tourism Research Australia (TRA), the Australian Bureau of Statistics (ABS), the Department of Home Affairs and the state tourism bodies — and are the latest available as of 2026.
Key Australia tourism statistics
- International visitors made 8.3 million trips to Australia in the year ending December 2025, up 8% on 2024 (Tourism Research Australia).
- International visitor spend in Australia hit a record A$39.2 billion in 2025, up 19% year on year (TRA).
- Total visitor economy spend — domestic plus international — reached A$192.4 billion in 2025, up 6.5% on 2024 (TRA annual benchmark report).
- Tourism GDP was A$81.1 billion in 2024–25 — 2.9% of the Australian economy — with 696,000 tourism-filled jobs, 4.4% of all employment (ABS Tourism Satellite Account).
- China is Australia's biggest-spending market, accounting for 29% of all international visitor spend in the year ending December 2025 (TRA International Visitor Survey).
- A record 206,187 working holiday makers were in Australia as at 30 June 2025, up from 170,437 at the end of 2023 (Department of Home Affairs).
- Australians took around 113 million domestic overnight trips in 2025, with day trips growing strongly (TRA).
International visitor spend: a record year
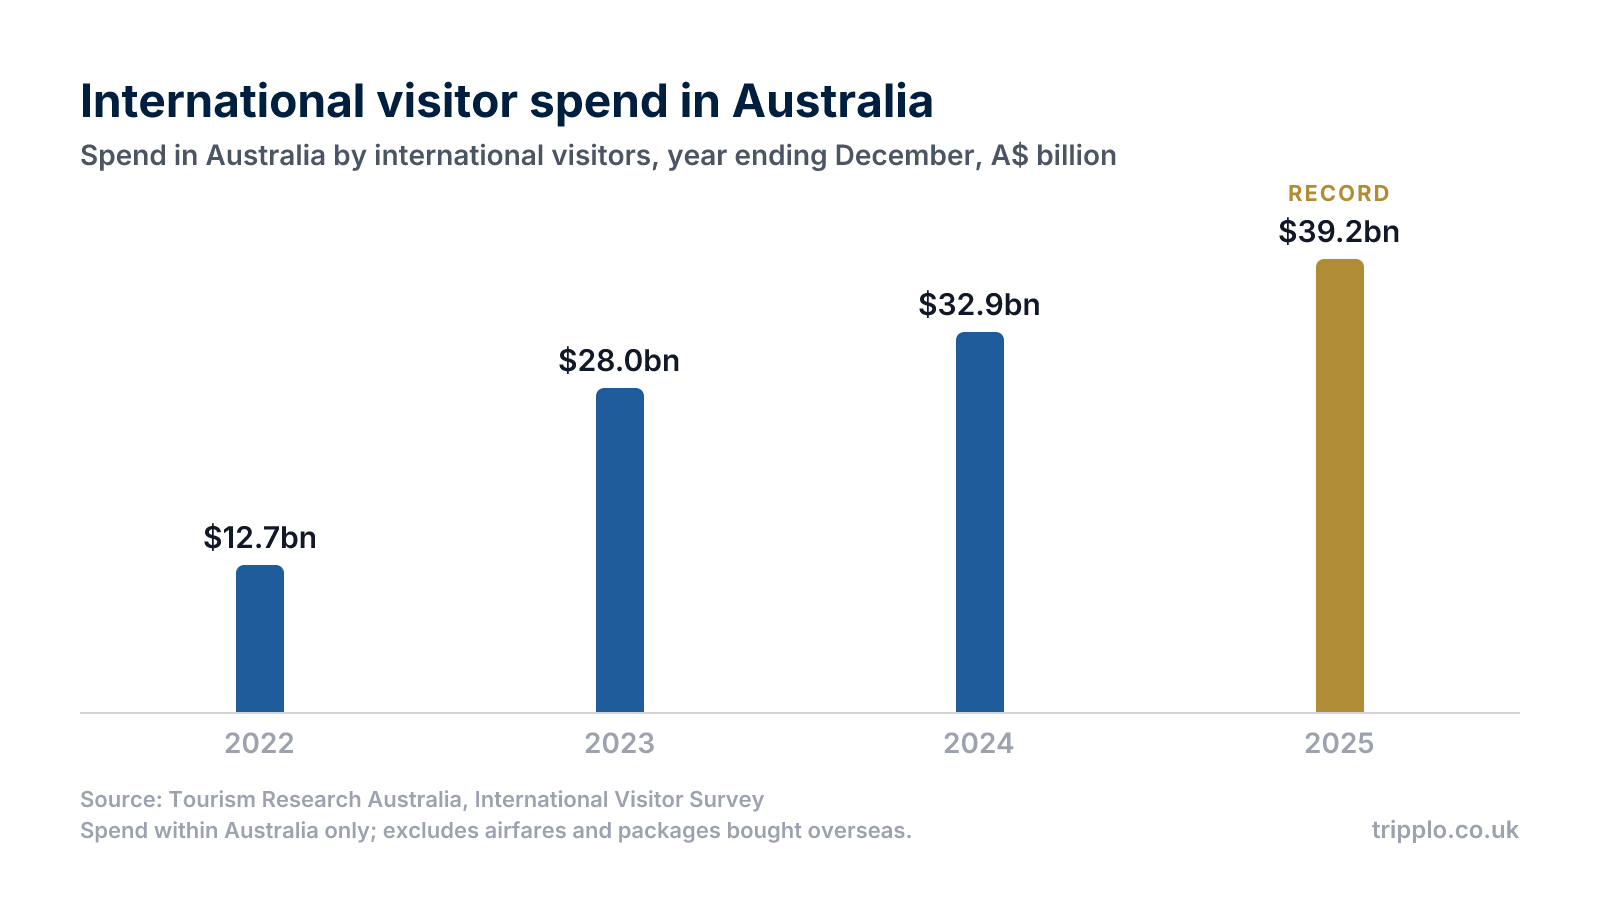
- Spend in Australia by international visitors reached A$39.2 billion in the year ending December 2025, up 19% on 2024 — more than three times the A$12.7 billion recorded in pandemic-hit 2022 (TRA).
- Including airfares and packages bought overseas, total trip spend was A$55.7 billion, up 14% year on year (TRA).
- Education was the biggest single spend category at A$14.5 billion (up 25%), ahead of holiday travel at A$12.9 billion (up 18%) and visiting friends and relatives at A$5.4 billion (TRA).
- In the December quarter 2025 alone, visitors spent A$9.8 billion — up 27% on a year earlier and 33% above the pre-COVID December quarter of 2019 (TRA IVS).
- The momentum has carried into 2026: in the year ending March 2026 spend in Australia rose to A$40.9 billion (up 20%) across 8.5 million trips (up 10%) and 321.9 million nights (up 9%), while total trip spend including airfares reached A$57.6 billion (up 16%); education spend hit A$15.3 billion and holiday spend A$13.5 billion (TRA).
Arrivals: back to pre-COVID levels
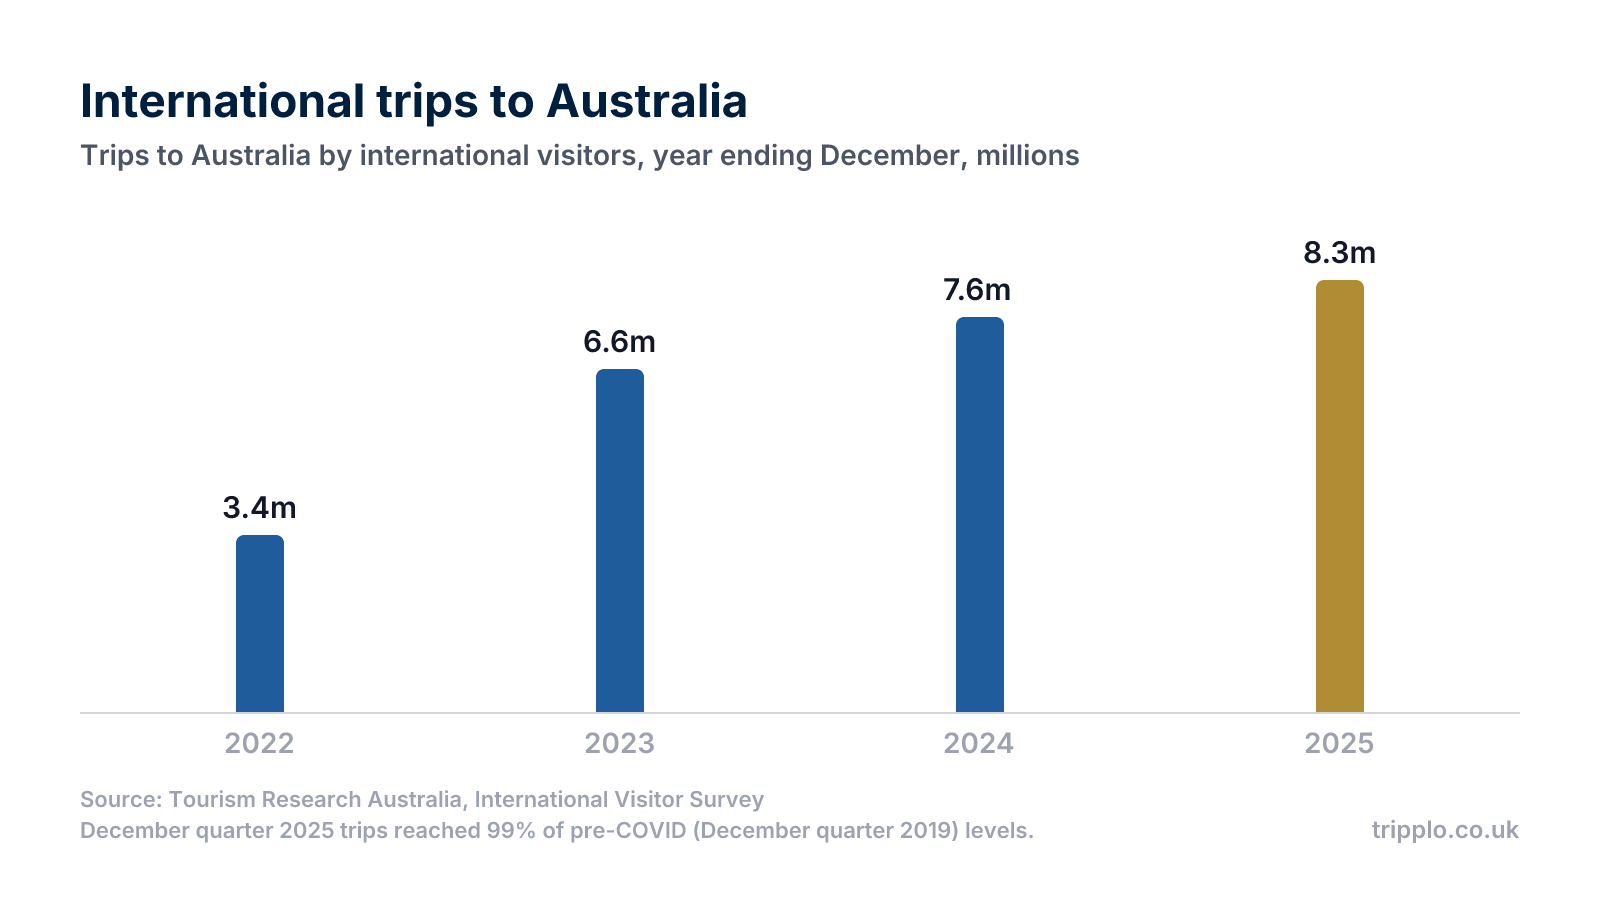
- International trips reached 8.3 million in the year ending December 2025 — up from just 3.4 million in 2022, 6.6 million in 2023 and 7.6 million in 2024 (TRA).
- On the ABS arrivals measure, TRA's benchmark report puts international arrivals at 8.9 million in 2025 (TRA annual benchmark report).
- December 2025 was Australia's biggest month of the year with 1,036,660 short-term visitor arrivals, up 9.7% year on year and just 3.8% below the December 2019 record of 1,077,720 (ABS).
- December quarter 2025 trips were at 99% of pre-COVID levels, while nights spent in Australia were 18% above the December quarter of 2019 (TRA IVS).
- Visitors stayed a combined 312.7 million nights in the year ending December 2025, up 6% on 2024 (TRA).
- The monthly ABS series softened in mid-2026: June 2026 brought 566,910 short-term visitor arrivals, 9.2% fewer than in June 2025 and 14.1% below June 2019, with New Zealand (98,960 trips, 17.5% of the total), China (58,970) and Singapore (54,260) the largest sources (ABS, June 2026).
Top source markets: New Zealand leads on trips, China on spend
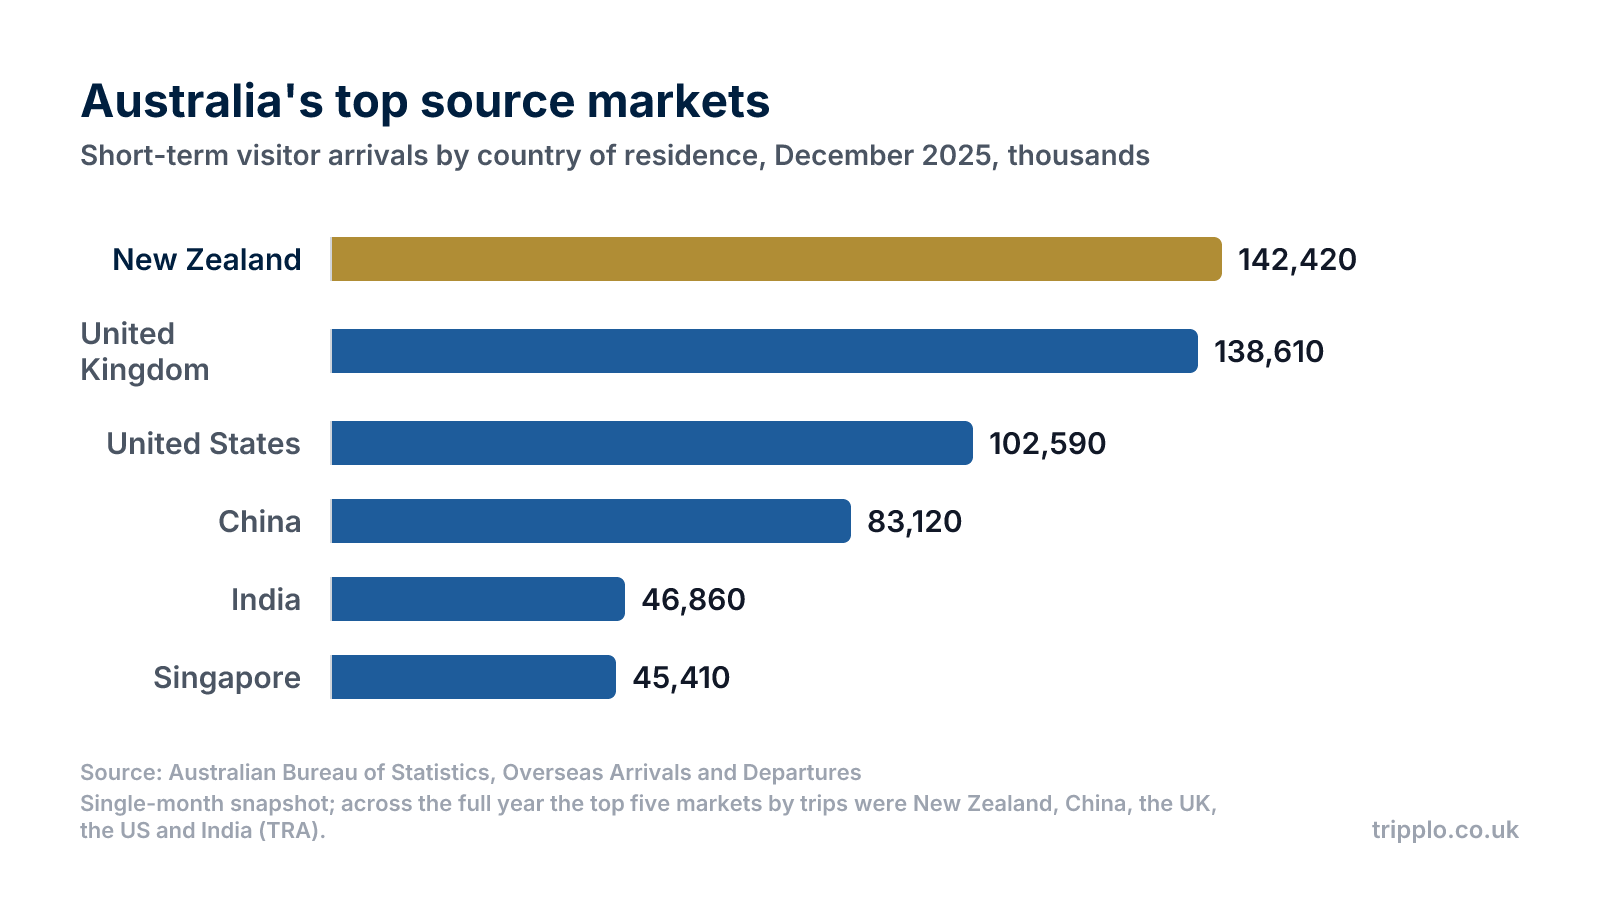
- The top five markets by trips in the year ending December 2025 were New Zealand, China, the United Kingdom, the United States and India (TRA IVS).
- China is the largest contributor to spend, at 29% of the total — its spend rose 39% year on year, with trips up 18% (TRA IVS). The UK follows on 7% of spend, with New Zealand and the US on 6% each.
- UK visitor spend jumped 31% and trips 19% in 2025, buoyed by working holiday travel and the 2025–26 Ashes series — UK arrivals in December 2025 alone surged 33.6% to 138,610 (ABS). For the outbound picture from Britain, see our London tourism statistics.
- In December 2025, New Zealand supplied 13.7% of all arrivals (142,420 trips), ahead of the UK (138,610), the US (102,590) and China (83,120) (ABS).
- Older travellers are a growing force: 41% of Australia's 2.8 million visiting-friends-and-relatives trips in 2025 were made by people aged 60 and over, who stayed an average of 37 nights (TRA IVS).
Visitor economy, GDP and jobs
- Tourism GDP reached A$81.1 billion in 2024–25, up 3.8% on the previous year and equal to 2.9% of the economy (ABS Tourism Satellite Account).
- Tourism supported 696,000 filled jobs in 2024–25 — 4.4% of total employment — with accommodation adding 11,700 positions, the most of any tourism industry (ABS).
- Domestic tourism consumption was A$168.8 billion and international consumption A$42.3 billion (up 10.1%) in 2024–25 (ABS).
- TRA's more recent benchmark measure counted 736,800 tourism-filled jobs as at December 2025, up 4.7% on a year earlier, with around 12,000 tourism vacancies advertised online (TRA annual benchmark report).
- The scale puts Australia among the world's major visitor economies — for comparison with another tourism-dependent hub, see our Dubai tourism statistics.
Domestic tourism: 113 million overnight trips
- Australians took around 113 million domestic overnight trips in the year ending December 2025, broadly stable on 2024, while day trips grew strongly (TRA).
- In the March quarter 2026, domestic overnight trips totalled 28.9 million with spend of A$29.7 billion, up 3% year on year (TRA Domestic Tourism Statistics).
- Day trips surged to 71.2 million in the same quarter (up 9%), with day-trip spend up 30% to A$13.0 billion — a clear shift towards shorter, lower-cost travel (TRA).
- Overnight travellers spent A$8.5 billion on accommodation, A$4.5 billion on takeaway and restaurant meals and A$4.1 billion on domestic airfares in the March quarter 2026 (TRA).
Sydney, Melbourne and the states
- New South Wales is Australia's largest visitor economy: expenditure hit A$59.4 billion in the year ending September 2025 (up 7.3%), including a record A$14 billion from 4 million international visitors (Destination NSW).
- Sydney welcomed 3.9 million international visitors in the year ending March 2026, who stayed 89.9 million nights and spent A$13.9 billion — roughly a third of Australia's entire international spend (Destination NSW).
- Victoria's visitor economy reached a record A$46.7 billion in the 12 months to December 2025, with international spend up 7% to A$9.7 billion; Melbourne remained the top destination for interstate overnight leisure travellers, with 3.5 million visitors spending A$5.9 billion (Visit Victoria).
- International spend grew in almost every state in 2025: South Australia led on growth (up 31%), followed by Western Australia (30%), Tasmania (29%), New South Wales (25%) and Queensland (20%) (TRA IVS).
Working holiday makers at record levels
- There were 206,187 working holiday maker (subclass 417 and 462) visa holders in Australia as at 30 June 2025, up from 170,437 at 31 December 2023 (Department of Home Affairs).
- The total reached a new year-end high of 225,901 at 31 December 2025, against 195,304 at 31 December 2024 (Department of Home Affairs temporary visa holder statistics).
- 141,841 working holiday visa applications were lodged in the six months to 30 June 2025, up 13.4% on the same period of 2024 (Home Affairs).
- The UK dominates first Working Holiday (417) grants with 42,383 in 2024–25, ahead of France (30,955), Germany (13,280), Italy (12,424) and South Korea (12,374) (Home Affairs).
- Third Working Holiday visa grants more than quadrupled (up 313.7%) in the first half of 2025, helped by the Australia–UK Free Trade Agreement exempting UK applicants from specified-work requirements (Home Affairs).
- Many working holiday makers travel independently — see our solo travel statistics and adventure travel statistics for the wider trend.
Sources
- Tourism Research Australia — International tourism results, year ending December 2025
- Tourism Research Australia — International tourism results, year ending March 2026
- Tourism Research Australia — International Visitor Survey results, December quarter 2025 (PDF)
- Tourism Research Australia — Annual benchmark report 2025
- Tourism Research Australia — Domestic Tourism Statistics results
- Australian Bureau of Statistics — Overseas Arrivals and Departures, December 2025
- Australian Bureau of Statistics — Overseas Arrivals and Departures, June 2026
- Australian Bureau of Statistics — Tourism Satellite Account, 2024–25
- Department of Home Affairs — Working Holiday Maker visa program report, 30 June 2025 (PDF)
- Department of Home Affairs — Temporary entrants and visa holders dataset (data.gov.au)
- Destination NSW — Record visitor expenditure for NSW
- Destination NSW — Sydney statistics
- Visit Victoria — Victoria's visitor economy reaches record high