Last reviewed 7 September 2026. Every figure on this page was checked against the source named next to it; where two official series disagree, the difference is stated.
London remains Europe's dominant city destination by a wide margin. The capital welcomed 20.9 million international visitors in 2024, who spent an estimated £17.3 billion — more than in either 2023 or pre-pandemic 2019 — while Heathrow handled an all-time record 84.5 million passengers in 2025. London alone accounts for almost half of all inbound visits to the UK. This guide breaks down the capital's tourism numbers: international arrivals, source markets, city comparisons, airports, hotels, attractions and domestic tourism. All figures come from official sources — the ONS International Passenger Survey, GLA Economics, VisitBritain, airport operators and ALVA — and are the latest available as of 2026.
Key London tourism statistics
- 20.9 million inbound visits to London in 2024, up from 20.3 million in 2023 and close to the 21.7 million of 2019 (ONS IPS via GLA Economics).
- Inbound visitors spent £17.3 billion in London in 2024 — up on both 2023 (£16.7 billion) and 2019 (£15.7 billion).
- The USA is London's biggest source market, with 3.7 million visits and £4.2 billion in spend in 2024.
- Heathrow set a new all-time record of 84.5 million passengers in 2025 (up 0.7% on 2024's 83.9 million); Gatwick handled 42.8 million (down 1.1% from its 2024 record of 43.2 million), Stansted a record 29.8 million and Luton 17.8 million (CAA).
- The Natural History Museum became the UK's most-visited attraction for the first time in 2025 with 7,116,929 visits, up 13%, ahead of the British Museum on 6,440,120 (ALVA).
- London had 145,984 hotel rooms across roughly 1,570 hotels as of September 2024 (HVS).
- Londoners and other Britons made 189 million domestic day visits to the capital in 2024 — 21% of England's total.
International visitors to London
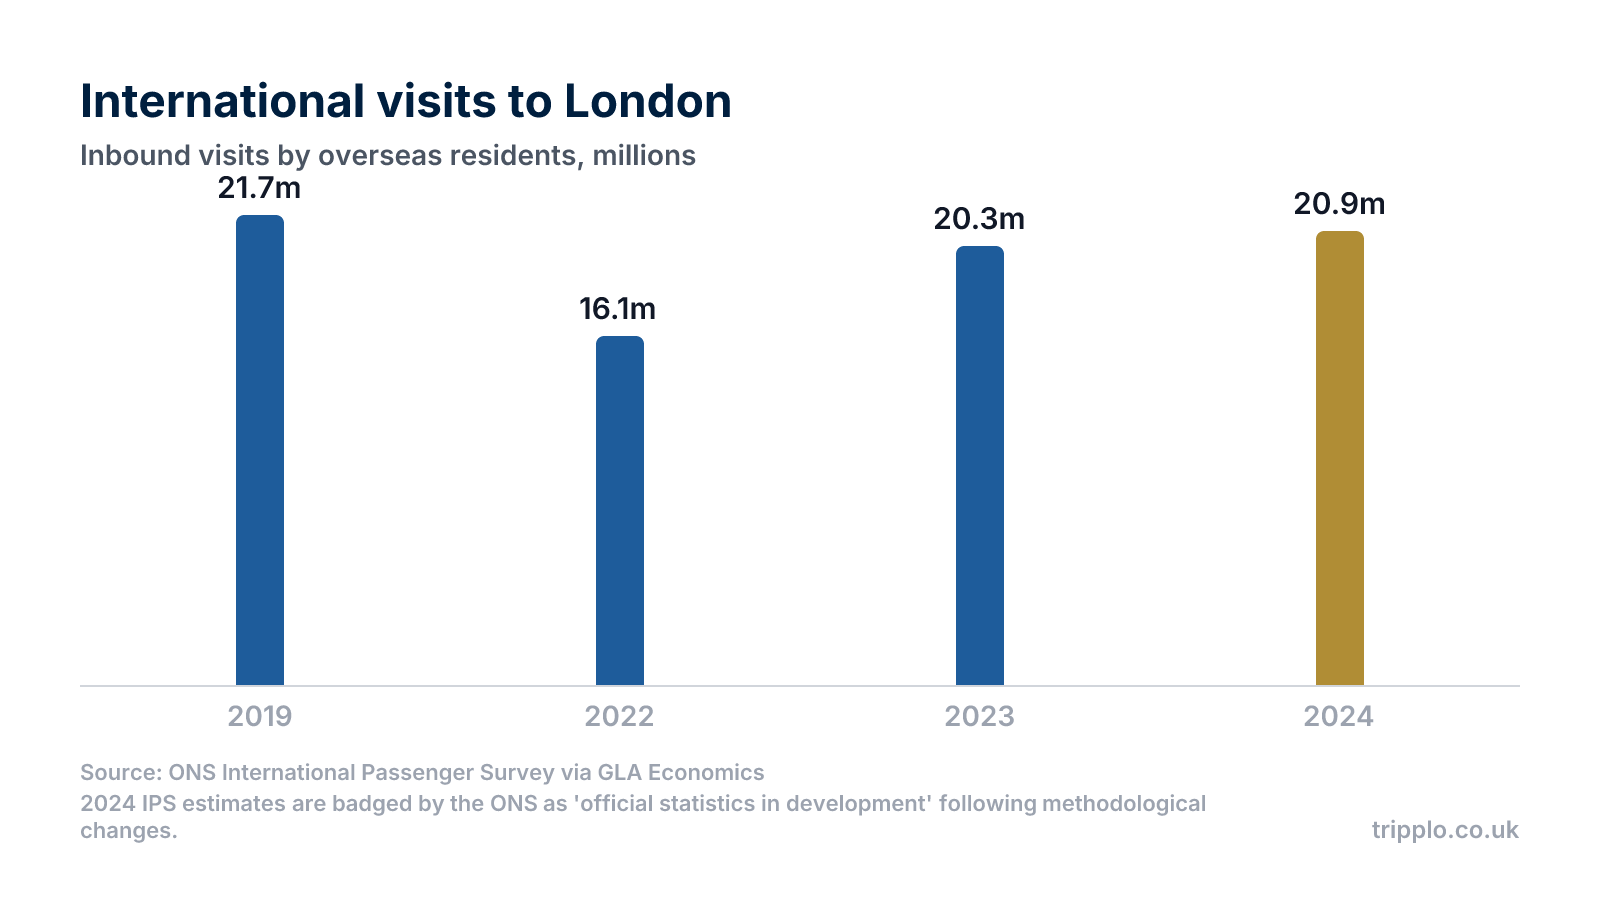
- London received 20.9 million international visits in 2024, up from 20.3 million in 2023 and broadly in line with the pre-pandemic level of 21.7 million in 2019, according to the ONS International Passenger Survey figures published by GLA Economics.
- Inbound spend reached £17.3 billion in 2024, up from £16.7 billion in 2023 and £15.7 billion in 2019 — VisitBritain confirms London's inbound spend was up against both years.
- The Covid recovery is essentially complete in volume terms: visits collapsed to 16.1 million in 2022 before rebounding by more than 4 million within a year.
- GLA Economics projects London will reach around 25.2 million international visitors and 139 million visitor nights by 2030.
- One caveat: the ONS badges 2024 IPS estimates as 'official statistics in development' after methodological changes, so year-on-year comparisons should be read with care. The ONS issued a further correction to the 2024 series on 4 September 2026 (affecting how destination airports were assigned from Q3 2024), and VisitBritain's town-level tables had not yet been updated to reflect it at the time of this review.
Where London's visitors come from
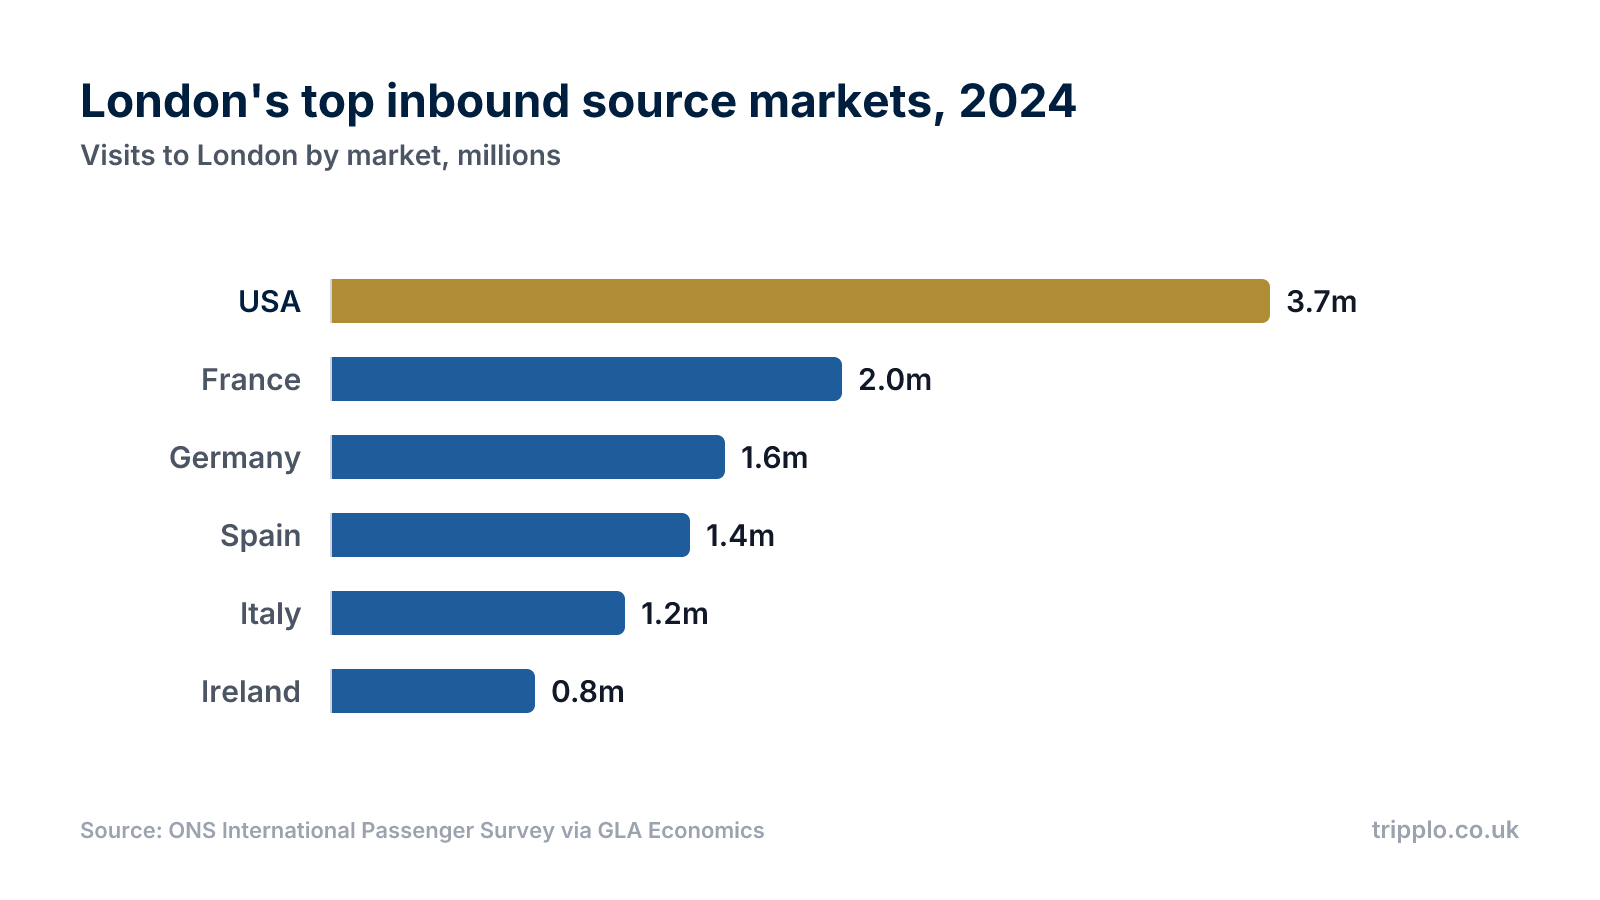
- The USA is London's most valuable market by far: 3.7 million visits and £4.2 billion in spend in 2024, per the GLA Economics analysis of IPS data.
- US visits grew 20% between 2019 and 2024, while American visitor spending in London rose by more than 70% over the same period.
- France was second with 2.0 million visits (£1.15 billion spend), followed by Germany with 1.6 million visits (£914 million).
- Spain (1.4 million visits) and Italy (1.2 million) round out the top five, with Ireland, the Netherlands, Australia, Poland and Canada completing the top ten.
- Australia punches above its weight on spend: 691,000 visits generated £746 million in 2024 — more than double Poland's spend from a similar visit volume.
London vs other UK cities
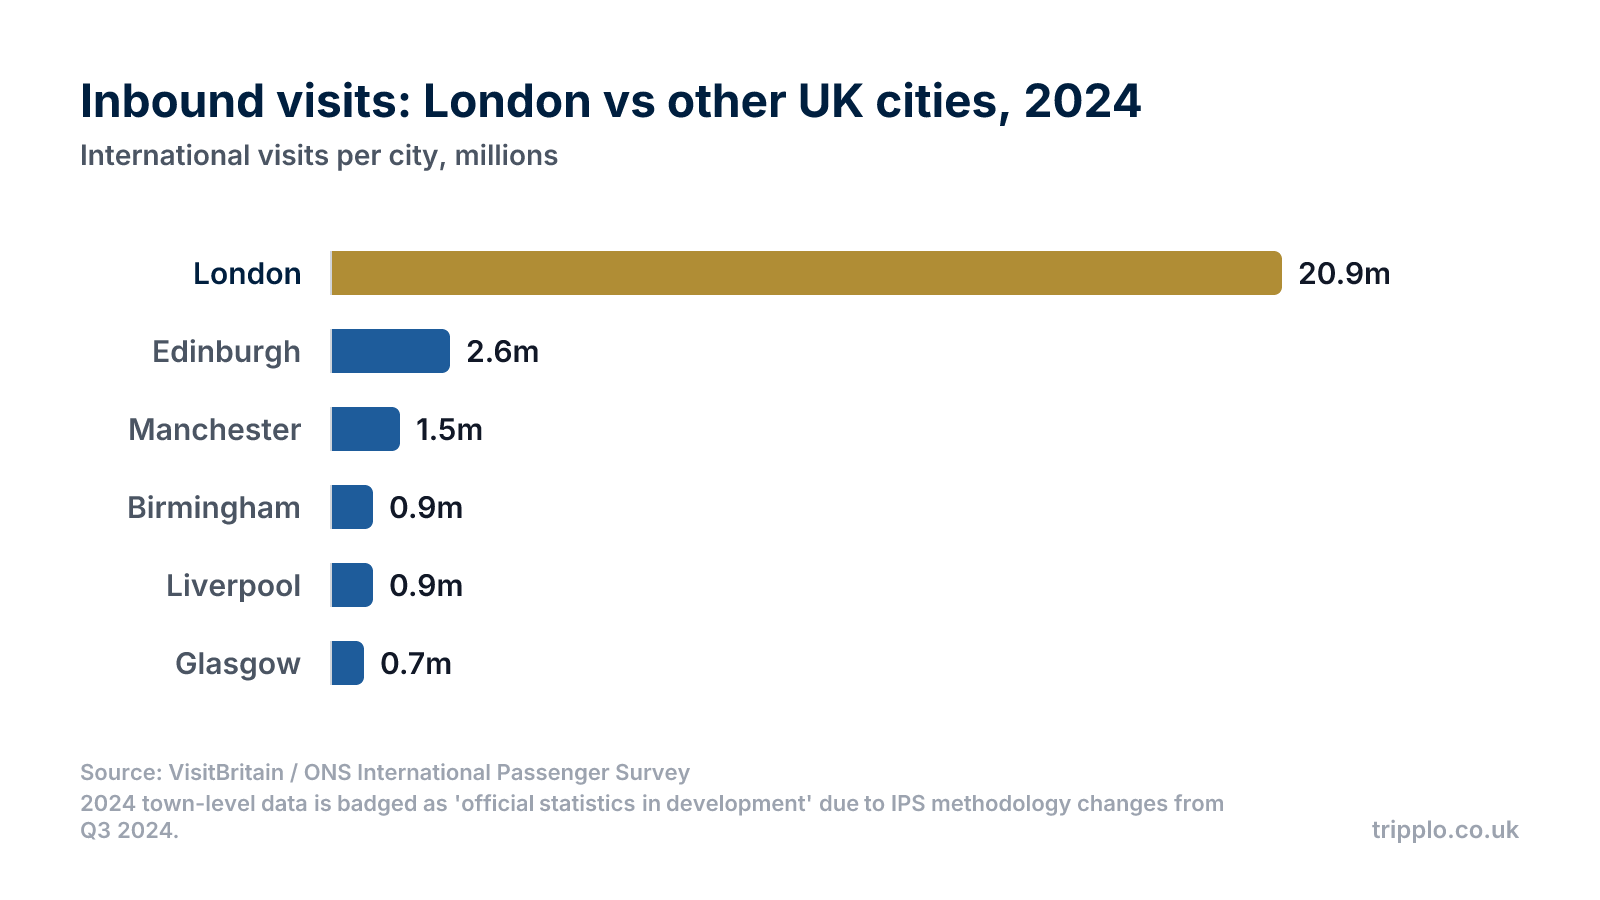
- London's 20.9 million inbound visits in 2024 were roughly eight times Edinburgh's 2.6 million — the next most-visited UK city — according to VisitBritain's town-level IPS data.
- Manchester followed with 1.5 million inbound visits, ahead of Birmingham (927,000), Liverpool (918,000) and Glasgow (736,000).
- The UK as a whole recorded around 42.6 million inbound visits and £31.6 billion in inbound spend in 2024 (ONS Travel Trends 2024) — meaning London captured almost half of all visits and over half of the spend. VisitBritain's forecast, revised on 27 August 2026, estimates 43.6 million UK visits and £33.2 billion of spend for 2025 and projects 44.2 million and £33.9 billion for 2026 (VisitBritain inbound forecast); London-level IPS figures for 2025 had not been published as of September 2026.
- VisitBritain notes visits to London recovered slightly more strongly in 2024 than visits to the rest of England.
Airports: record years at Heathrow and Gatwick
- Heathrow handled a record 83.9 million passengers in 2024, up 6% year on year and beating its previous record of 80.9 million set in 2019 (Heathrow media centre).
- Heathrow beat its own 2025 forecast of around 84.2 million: it handled a record 84.5 million passengers in 2025, up 0.7%, with almost 7.2 million in December — its busiest December ever — and its busiest single day on 1 August 2025, when about 270,000 passengers passed through (Heathrow results for 2025).
- The first half of 2026 brought a record 40.0 million passengers (up 0.2%), with growth to North America (+1.6%) and Asia-Pacific (+7.9%) offsetting softer Middle East demand; Heathrow says it is on track for around 85 million passengers in 2026 (Heathrow H1 2026 results).
- Gatwick welcomed a record 43.2 million passengers in 2024, up 5.7%, served by 57 airlines — the most in its history (Gatwick media centre). In 2025 it slipped 1.1% to 42.8 million as short-haul traffic fell 1.9% on aircraft-availability problems while long-haul grew 3.3% (Gatwick 2025 results), and the first half of 2026 was harder still: 19.1 million passengers, down 4.7%, as the Middle East conflict hit long-haul demand (Gatwick H1 2026 results).
- Stansted had its busiest year ever in 2025 with 29.8 million terminal passengers (up 0.2%, CAA; the airport rounds this to 30 million), while Luton grew 4.9% to 17.8 million and has government approval to expand to 32 million passengers a year by 2032 (CAA airport data 2025, Stansted, Luton).
- London City carried 3.6 million passengers in 2024, up 4.6%, and nearly doubled pre-tax profit from £6.6 million to £11.8 million (City AM); CAA data show a further 4.6% rise to 3,737,888 passengers in 2025.
- London City has secured planning permission to raise its annual passenger cap from 6.5 million to 9 million (AeroTime).
Hotels: supply, occupancy and pipeline
- London had 145,984 hotel rooms across roughly 1,570 hotels as of September 2024, with four-star properties making up over 36% of supply and budget hotels almost 20% (HVS London Market Pulse 2024).
- Citywide occupancy reached 77% in 2023, up from 75% in 2022 but still around 3 percentage points behind 2019; average rates and RevPAR had already surpassed pre-pandemic levels by 2023.
- Central London full-service hotels ran at 84% occupancy in 2025 with gross operating profit of £135.5 per available room, and London ranks third among European markets for occupancy (HotStats and STR via Hospitality Net).
- Across the whole London market, Colliers puts 2025 occupancy at 81.2% with the UK's highest average daily rate of £194 (up 3.1%), lifting London to second place behind Edinburgh in the Colliers UK Hotel Market Index 2026, published in March 2026 (The Caterer/Colliers).
- 25 new hotels opened in London in 2024, adding around 2,700 rooms, with some 60 further projects and 6,150 rooms slated for 2025 (London & Partners).
- HVS counts 86 hotels totalling 11,155 rooms scheduled to open between 2024 and 2026; recent luxury openings include the Peninsula London (190 rooms), Raffles London at The OWO (120) and Mandarin Oriental Mayfair (50).
- For context on the wider market, England-wide hotel room occupancy stood at 86% in July 2026, with an average daily rate of £198 (VisitBritain).
Attractions: what the ALVA 2025 figures show
- The Natural History Museum was the UK's most-visited attraction in 2025 — the first time it has topped the list — with 7,116,929 visits, up 13% on 2024, according to ALVA figures published in March 2026 (ALVA, Museums Association).
- The British Museum slipped to second with 6,440,120 visits (down 1%), while the National Gallery jumped 29% to 4,147,544 after the reopening of its refurbished Sainsbury Wing and Tate Modern eased 2% to 4,514,266.
- Other leading London venues in 2025: Southbank Centre (3,423,648), V&A South Kensington (3,332,300), Somerset House (2,895,010), Royal Museums Greenwich (2,364,348), Royal Albert Hall (1,719,156), Westminster Abbey (1,610,182) and the Barbican Centre (1,587,017).
- The Tower of London remained the UK's most-visited paid attraction with 2,817,852 visits in 2025 (ninth overall), while the Science Museum recorded 2,640,417 and Kew Gardens 2,250,355. For comparison, 2024's leaders were the British Museum (6,479,952, up 11%) and the Natural History Museum (6,301,972) (ALVA 2024 figures via Museums + Heritage).
- Across all 409 reporting ALVA sites, visits totalled 165 million in 2025 — up 2% year on year; that total was, however, still 7% below the roughly 170 million recorded in 2019. In 2024 the total had been 157.2 million, up 3.4%, with London attractions collectively growing around 3%.
Domestic tourism in London
- London recorded 189 million domestic day visits in 2024 — 21% of England's total — up from 175 million in 2022 (GLA Economics, citing VisitBritain).
- The capital had 15.1 million domestic overnight trips in 2024, a 17% share of England's total, up from a 15% share in 2022.
- GLA Economics projects domestic overnight visitors will stabilise at around 14.5 million per year by 2029, with domestic visitor spending levelling off at roughly £4.8 billion (in real 2022 prices).
- Nationally, Britons made 87 million overnight trips in England in 2025, down 3% on 2024, but spent 6% more (£29 billion), and England took 928 million day visits worth £49 billion (VisitBritain GBTS/GBDVS annual results, June 2026); London-level 2025 domestic figures were not yet published.
- A note of caution: methodological changes to the domestic tourism surveys mean pre- and post-Covid domestic figures are not fully comparable.
Sources
- GLA Economics — Tourism in London: Recent Trends (February 2026)
- VisitBritain — Inbound visits and spend: trends by UK town
- VisitBritain — Inbound visits and spend: annual, regional
- VisitBritain — Inbound visits and spend: annual, UK
- VisitBritain — England hotel occupancy
- Heathrow — results for the year ended 31 December 2024
- London Gatwick — 2024 performance report
- City AM — London City Airport 2024 results
- AeroTime — London City Airport passenger cap
- ALVA — Visitor figures 2025 (published March 2026)
- Museums Association — Natural History Museum breaks all-time record (ALVA 2025)
- ALVA 2024 visitor figures — via Museums + Heritage
- ONS — Travel trends 2024
- VisitBritain — Inbound tourism forecast (revised 27 August 2026)
- VisitBritain — Domestic tourism: latest annual results (2025)
- Heathrow — results for the year ended 31 December 2025
- Heathrow — results for the six months ended 30 June 2026
- International Airport Review — London Gatwick 2025 performance
- RTÉ — Gatwick H1 2026 results
- UK Civil Aviation Authority — Annual airport data 2025
- Saffron Walden Reporter — Stansted record 2025
- British Aviation Group — London Luton Airport 2025
- The Caterer — Colliers UK Hotel Market Index 2026
- HVS — London Market Pulse 2024
- Hospitality Net — London hotel profitability (HotStats/STR)
- London & Partners — new hotels transforming London in 2025