
Last reviewed 7 September 2026. Every figure on this page was checked against the source named next to it; where two official series disagree, the difference is stated.
Aruba has emerged from the pandemic as one of the Caribbean's strongest performers. The island welcomed a record 1,421,616 stay-over visitors in 2024, 13 per cent more than in 2023 and 127 per cent of its 2019 level, before adding a further 7 per cent in 2025 to a new record of 1,515,102. Cruise arrivals set their own record at 970,803 passengers in 2025, and tourism receipts climbed to roughly Afl. 5.6 billion in 2025, 8 per cent above the Afl. 5.4 billion of 2024 — itself the highest figure since at least 2011. Growth has continued into 2026, with stay-over arrivals running 13–14 per cent ahead of 2025 in May, June and July. Few economies on earth lean on tourism as heavily as Aruba's. The figures below are drawn from the Aruba Tourism Authority, the Government of Aruba, the Centrale Bank van Aruba, the Aruba Ports Authority and the IMF, and are the latest available as of 2026.
Key Aruba tourism statistics
- Aruba received 1,421,616 stay-over visitors in 2024, up 12.8 per cent on the 1,260,402 recorded in 2023 (Aruba Tourism Authority / Government of Aruba).
- The audited A.T.A. Annual Report 2025 confirms 1,515,102 stay-over visitors in 2025, 7 per cent (6.6 per cent unrounded) more than in 2024 and ahead of the authority's own projections (A.T.A. Annual Report 2025, reported by 24ora).
- Momentum strengthened in 2026: 427,343 stay-over visitors arrived in the first quarter (up 8.9 per cent), and monthly arrivals were 14.1 per cent higher in May, 13.4 per cent higher in June (143,343 visitors) and 13.4 per cent higher in July 2026 than a year earlier (A.T.A. monthly results).
- The United States alone supplied 1,062,610 visitors in 2024 — a 74.7 per cent market share, with North America as a whole at 79.7 per cent.
- Cruise arrivals hit a record 970,803 passengers from 376 ship calls in 2025, up from 897,273 in 2024 (Aruba Ports Authority).
- Tourism receipts reached an estimated Afl. 5.4 billion (about US$3.0 billion) in 2024, 16 per cent up on 2023, and rose a further 8 per cent to about Afl. 5.6 billion in 2025; the A.T.A. puts total visitor expenditure in 2025 at US$3.06 billion.
- International tourism receipts are equivalent to roughly 70 per cent of Aruba's GDP, making it one of the two most tourism-dependent economies in the world; the IMF estimates tourism directly generated 44 per cent of GDP and 36 per cent of jobs even in pandemic-hit 2020.
- Hotel revenue per available room (RevPAR) climbed to a record US$298 in 2024, 12 per cent above 2023 (AHATA).
Stay-over arrivals: a record-breaking recovery
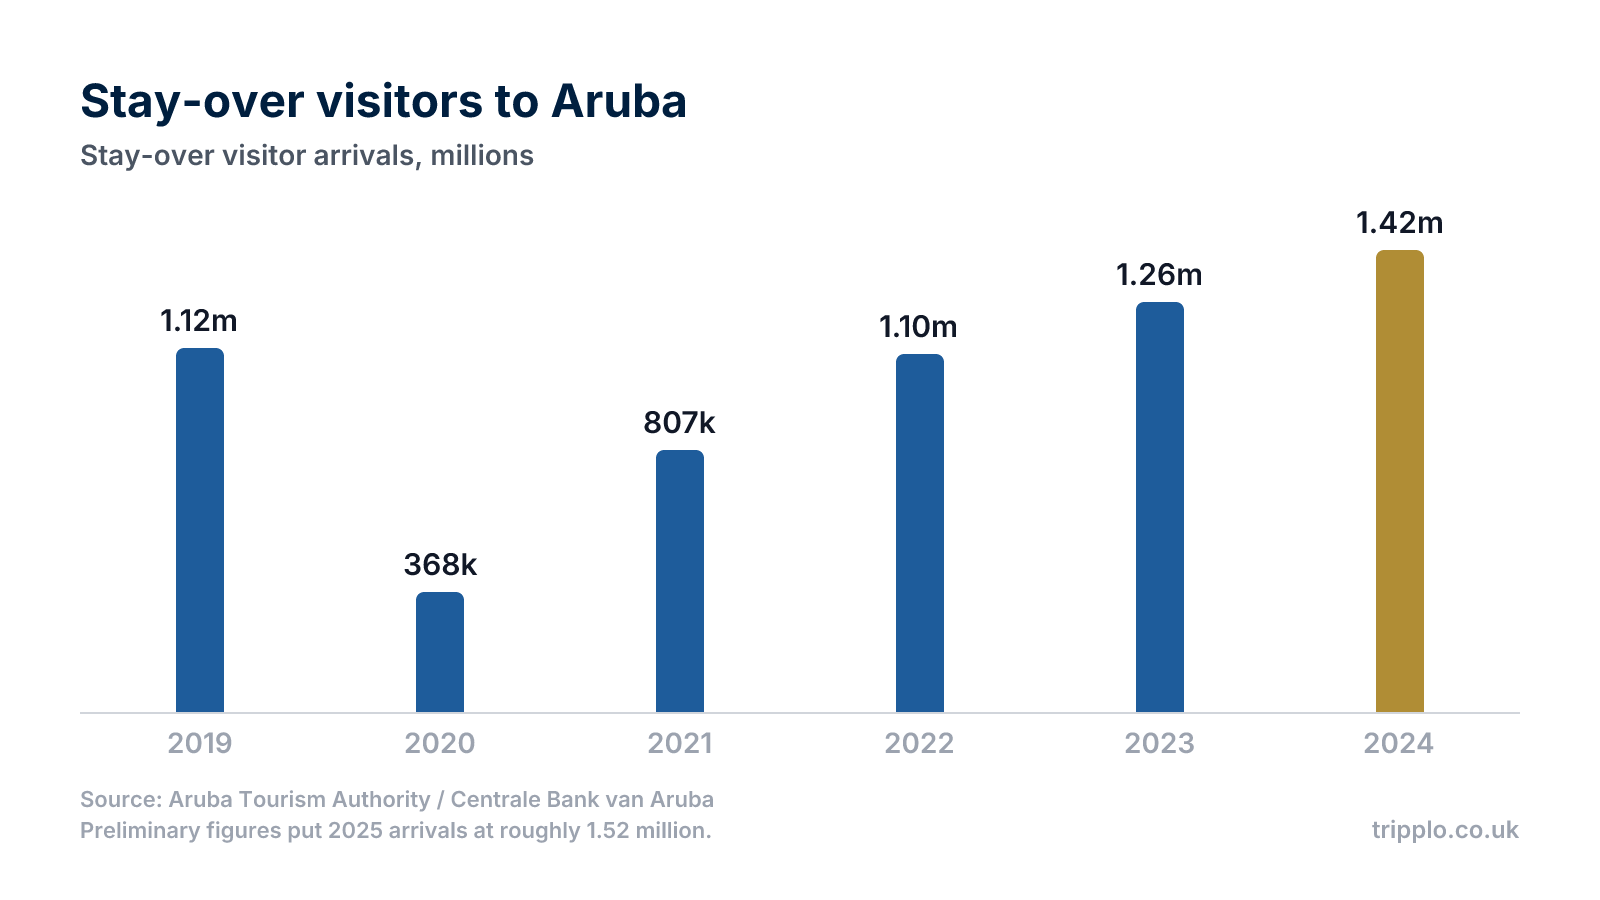
- Stay-over arrivals collapsed from 1,118,944 in 2019 to 368,322 in 2020, then recovered through 806,531 (2021) and 1,100,997 (2022) to pass the pre-pandemic peak in 2023, according to the A.T.A. Annual Report 2024.
- 2024 closed at 1,421,616 stay-over visitors — a 127 per cent recovery versus 2019 and a 12.8 per cent rise on 2023, per the Government of Aruba.
- Growth continued into 2025: Tourism Analytics reports 1,515,102 stop-over visitors in 2025, up 6.6 per cent (a figure since confirmed in the A.T.A.'s audited Annual Report 2025), with December 2025 alone up 14.3 per cent year on year at 146,515 visitors.
- Momentum carried into 2026: Aruba received 136,578 stay-over visitors in January 2026, who spent 1,064,432 nights on the island, per the A.T.A. January 2026 results.
- By June 2026 the island was welcoming 143,343 stay-over visitors a month — 13.4 per cent more than in June 2025 — who spent 912,256 visitor nights on the island; the United States supplied 102,224 of them and Argentina 11,682, a sharp rise on a year earlier (A.T.A. June 2026 results).
- For comparison with other sun-and-sea markets rebuilding after the pandemic, see our Greece tourism statistics.
Source markets: the American engine
- The USA delivered 1,062,610 tourist arrivals in 2024, up 11.4 per cent, for a 74.7 per cent market share; the north-eastern states (led by New York, New Jersey, Connecticut and Pennsylvania) accounted for 56.6 per cent of the US market (A.T.A. Annual Report 2024).
- North America as a whole contributed 79.7 per cent of 2024 arrivals, against 12.8 per cent from Latin America and 4.9 per cent from Europe (Government of Aruba).
- US airlift grew strongly in 2024: seat capacity rose 18 per cent (an extra 195,193 seats) and airlines serving the US market flew at an 88 per cent average load factor.
- Latin America was the fastest-growing region in 2024, with stay-over visitors up 38 per cent, helped by new LATAM flights from Lima; Europe declined 6.5 per cent as seats from Amsterdam were cut.
- The pattern held in late 2025: North America took 77.7 per cent of December 2025 arrivals, with Argentina, Brazil and Colombia driving Latin American growth (A.T.A. via Aruba News).
- By mid-2026 the mix had tilted further south: North America supplied 73.6 per cent of June 2026 arrivals, South America 20.3 per cent and Europe 3.5 per cent, against 74.4, 19.0 and 4.1 per cent respectively in May 2026 (A.T.A. May and June 2026 results).
- Many of Aruba's American visitors connect through Florida — see our Miami tourism statistics for the gateway's own numbers.
Cruise tourism: a new record
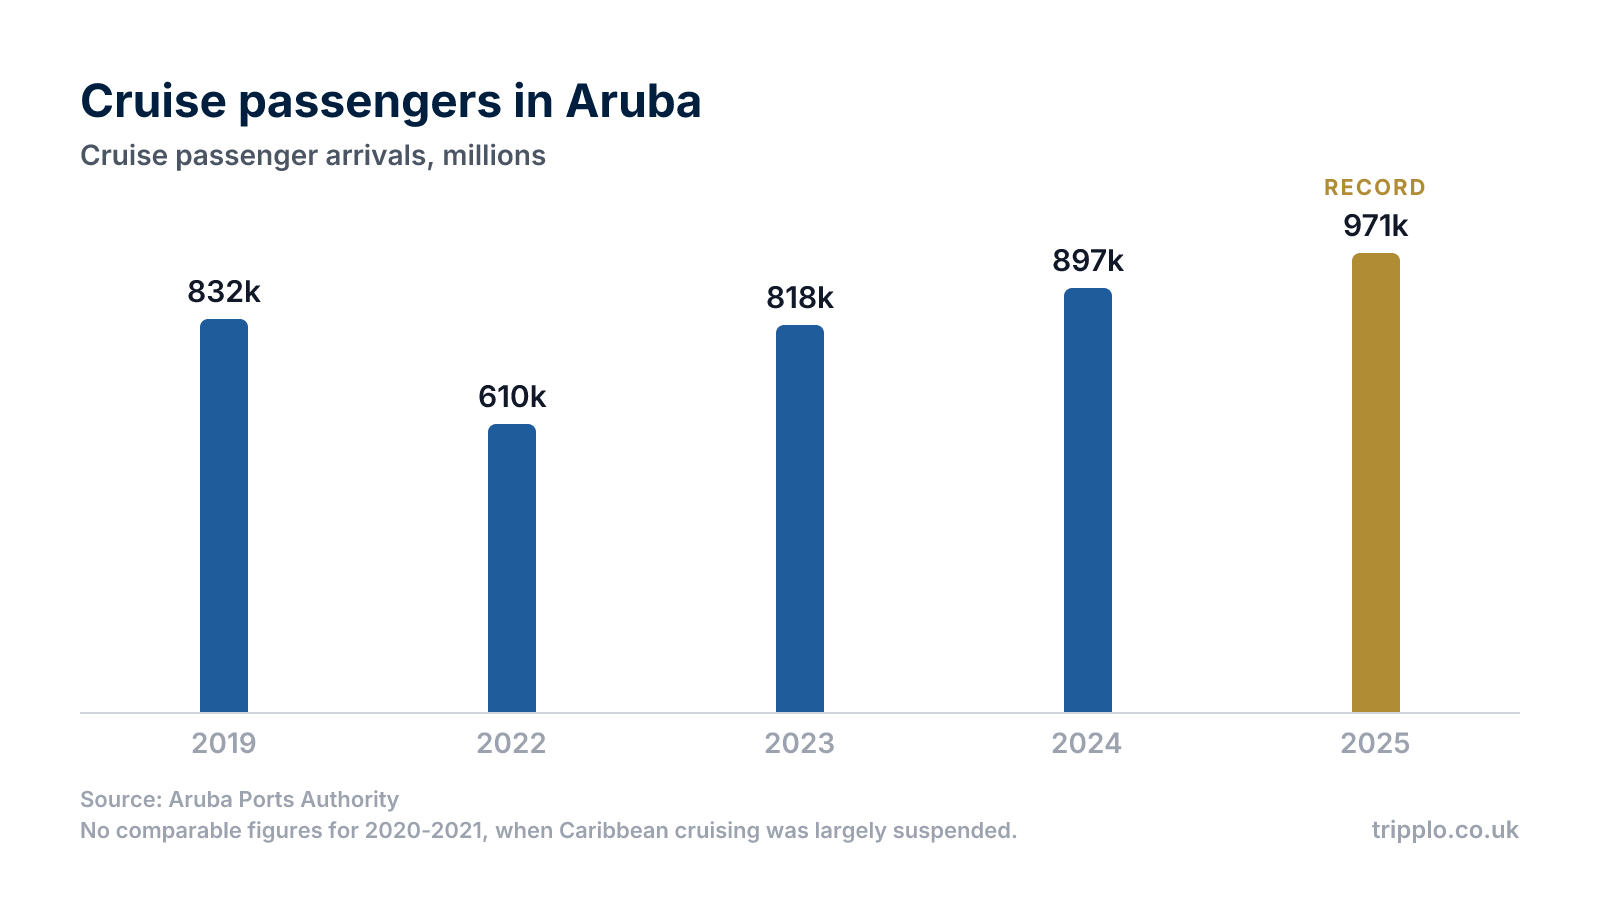
- The port of Oranjestad handled 970,803 cruise passengers from 376 calls in 2025 — the highest total in the Aruba Ports Authority's published series.
- 2024 saw 897,273 cruise visitors from 347 calls, up from 817,670 passengers and 317 calls in 2023 and an all-time high at that point, surpassing the pre-pandemic record of 832,001 in 2019 (Aruba Ports Authority; A.T.A. Annual Report 2024).
- The recovery was rapid: cruise arrivals rose from 610,474 in 2022 to 817,670 in 2023 — a 34 per cent jump — before the 2024 and 2025 records.
- 2026 is tracking higher still: the port logged 590,415 cruise passengers from 227 calls in January–July 2026, about 6 per cent more than in the same months of 2025, and the A.T.A.'s 2025 cruise survey found passengers spent an average of US$197 each on the island, with 81 per cent saying Aruba's place on the itinerary influenced their booking (Aruba Ports Authority; A.T.A. June 2026 results).
The visitor economy: among the world's most tourism-dependent
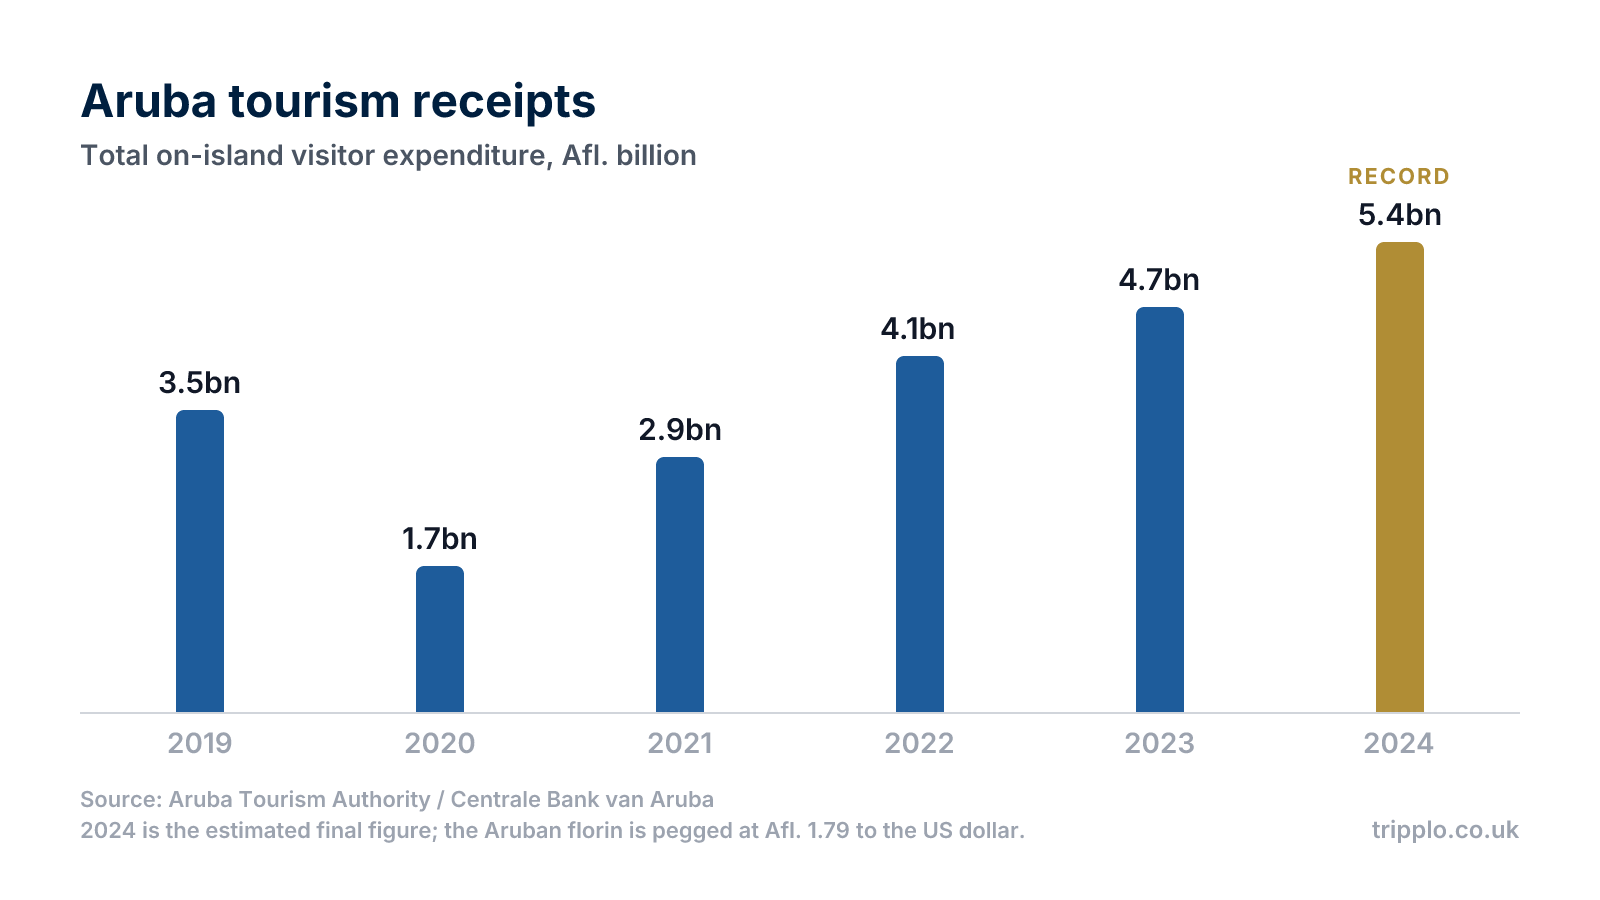
- Tourism receipts — total on-island expenditure — reached an estimated Afl. 5.4 billion in 2024, 16 per cent above 2023 and roughly 55 per cent above the 2019 level, the highest figure recorded since 2011 (A.T.A. Annual Report 2024).
- The 2025 annual report lifts the figure again: tourism revenue of roughly Afl. 5.6 billion in 2025, up 8 per cent, on an average daily spend of about Afl. 550 (A.T.A. Annual Report 2025, via 24ora).
- For 2025, the A.T.A. put total visitor expenditure at US$3.06 billion, with an average daily spend of US$297 and North America accounting for US$2.37 billion (78 per cent) of the total (Government of Aruba).
- Average daily tourist spending rose to Afl. 553 per day in 2024, up 7 per cent on 2023 and well above the Afl. 423 recorded in 2019.
- International tourism receipts are equivalent to about 69.7 per cent of Aruba's GDP — second only to Macao worldwide, ahead of the Maldives at 68.1 per cent (Visual Capitalist, using UN Tourism and IMF data).
- An IMF working paper notes that even in 2020 tourism directly created 44 per cent of Aruban GDP and 36 per cent of its jobs.
- Tourism remained the main engine of growth in 2024: the Centrale Bank van Aruba reported the economy expanded 7.7 per cent in the first half of 2024, with stay-over visitors up 19.0 per cent in that period.
- Aruba's "High-Value, Low-Impact" strategy mirrors a wider premium shift in travel — see our luxury travel statistics.
Hotels and accommodation
- AHATA member hotels achieved a record RevPAR of US$298 in 2024, up 12 per cent on 2023's US$266 and well above the 2019 figure of US$234 (AHATA, via the A.T.A. Annual Report 2024).
- Average daily rates at AHATA hotels rose 7 per cent in 2024, continuing a run of post-pandemic rate growth.
- Occupancy cooled as new supply and record rates bedded in: AHATA reported average hotel room occupancy of 63.3 per cent in September 2025, down from 70.2 per cent in September 2024 (Tourism Analytics).
- Occupancy firmed again as the new rooms filled: AHATA members averaged 76.8 per cent in November 2025, 86.4 per cent in March 2026 and 70.8 per cent in June 2026 (AHATA via Tourism Analytics).
- Short-term vacation rentals are taking share fast: alternative accommodation (including STVRs) hosted 33 per cent of stay-over visitors in 2024, up from 29 per cent in 2023, and 37 per cent of visitor nights — more than European Plan hotels (21 per cent) and all-inclusives (14 per cent) combined (A.T.A. Annual Report 2024).
- STVR occupancy averaged 58 per cent in 2024, and in December 2025 reached 60 per cent at an average daily rate of US$449 (A.T.A. via Aruba News).
- The swing towards rentals reflects how travellers now book — our online travel booking statistics chart that shift.
Length of stay, spend and the 2026 outlook
- Visitors stay long by Caribbean standards: January 2026 arrivals averaged 7.8 nights on the island, May 2026 arrivals 7.0 nights and June 2026 arrivals 6.4 nights (Government of Aruba).
- Spend per visitor averaged US$1,916 in 2024 and rose only 1.7 per cent in 2025, per Tourism Analytics — volume, not per-head spend, drove 2025's growth. On the A.T.A.'s own 2025 visitor survey the average was US$2,019 per person per stay, or US$4,989 per travel party, with 64 per cent of visitors on their first trip (Government of Aruba).
- Visa card data logged 1,028,071 cardholders from 152 countries spending US$696 million in Aruba during 2025, led by restaurants and dining at US$204.4 million (A.T.A. January 2026 results).
- Visitor satisfaction held at a monthly average of 9.0 out of 10 through 2024 (A.T.A. Annual Report 2024).
- Readings through 2026 have stayed positive — 136,578 stay-over visitors in January, 133,680 in May and 143,343 in June, with July 2026 up 13.4 per cent year on year — and North America still supplies about three-quarters of arrivals.
Sources
- Aruba Tourism Authority — Annual Report 2024
- Government of Aruba — Strong Tourism in 2024
- Government of Aruba — A.T.A. January 2026 results
- Government of Aruba — A.T.A. May 2026 results
- Government of Aruba — A.T.A. June 2026 results and 2025 cruise tourism survey
- 24ora — A.T.A. Annual Report 2025: strong tourism growth and strategic progress in 2025
- Tourism Analytics — Aruba tourism statistics (A.T.A. and AHATA monthly data)
- Government of Aruba — Tourism results November 2025
- Aruba Ports Authority — Detailed cruise data
- Centrale Bank van Aruba — Economy press release, December 2024
- IMF Working Paper WP/22/226 — Modeling and Forecasting Monthly Tourism Arrivals to Aruba
- Tourism Analytics — Aruba 2025 results
- Aruba News — December 2025 tourism results
- Visual Capitalist — Countries most dependent on tourism